It is one of the more popular topics gracing LinkedIn right now, and one of the most polarising. Ask whether AI means organisations will stop buying software and start building it, and most people have already picked a side.
The "SaaS is finished" camp says AI writes the code now, and business apps are just databases with some logic on top. Paying per seat for someone else's idea of your process is a habit about to break. In February the share market agreed and wiped around a trillion US dollars off software stocks, and the got its name.
A trillion dollars in a week or so
On 30 January 2026 Anthropic added plugins to its Claude Cowork agent, covering work like sales, legal and finance. By 10 February the ACS's Information Age was reporting that the S&P 500 software and services index had shed about US$1 trillion since 28 January, and sat about 25% below its October 2025 peak.
The word itself is attributed, second-hand, to Jefferies' equity trading desk. The investor thesis, in TechCrunch's paraphrase, was that AI agents could make "per-employee-seat business models obsolete".
Information Age, 10 February 2026 →The other camp says this is naive. Building is the cheap part and maintenance is where costs really live, so Kevin's vibe-coded app knocked up over a weekend is a security incident waiting to happen, and anyone who thinks they can replace a CRM in two months has never had to run one for five years. The market has since come halfway round to that view, with a in software stocks.
Most of the way back, not all of it
Software stocks fell about 27% from the end of 2025 to a low on 10 April. By early October, Hargreaves Lansdown found they had won back around 94% of the loss, but were still slightly down for the year while the S&P 500 was up 13%. Workplace and business apps, the closest group to the SaaS this debate is about, had won back 83% and were still down 6% for the year.
The recovery was uneven. Reuters reported cybersecurity names such as CrowdStrike, Fortinet and Palo Alto Networks up by triple-digit percentages for the year, while consumer and internet software had won back only 11% of its losses.
Hargreaves Lansdown, 7 October 2026 → Reuters, 6 October 2026 →Both camps have their , and I'll be upfront about ours. We with AI, and we have written on these pages that cheap software and expensive money are squeezing the SaaS moat, so, full disclosure, we are not neutral observers.
One anecdote each
For building: Curative cancelled a Salesforce contract worth about US$600,000 a year after building its own CRM with AI-assisted coding in about two months. Its CEO also called maintenance one of the hardest parts.
Against: In 2024 Klarna said it had "shut down Salesforce". In March 2025 its CEO said he was "tremendously embarrassed" by how that had been read: "no, we did not replace SaaS with an LLM".
Each side gets to pick the anecdote that suits.
CX Today on Klarna, 4 March 2025 → Startup Fortune on Curative, 22 July 2026 →Our own position
We built our own CRM for almost nothing, then kept going until it became the platform that runs the whole business. The company trying to sell you one borrowed heavily, and the bond market is repricing that bet.
Read the full article →Which is exactly why we needed to test our own position. We are empiricists and investors, and one datapoint is not a trend. What worked for us does not mean the conclusion translates to every other organisation.
So rather than write another article that picks a side, we built a tool that would tell us when we are wrong. And we used AI to do it.
Why Not Just Use a Spreadsheet?
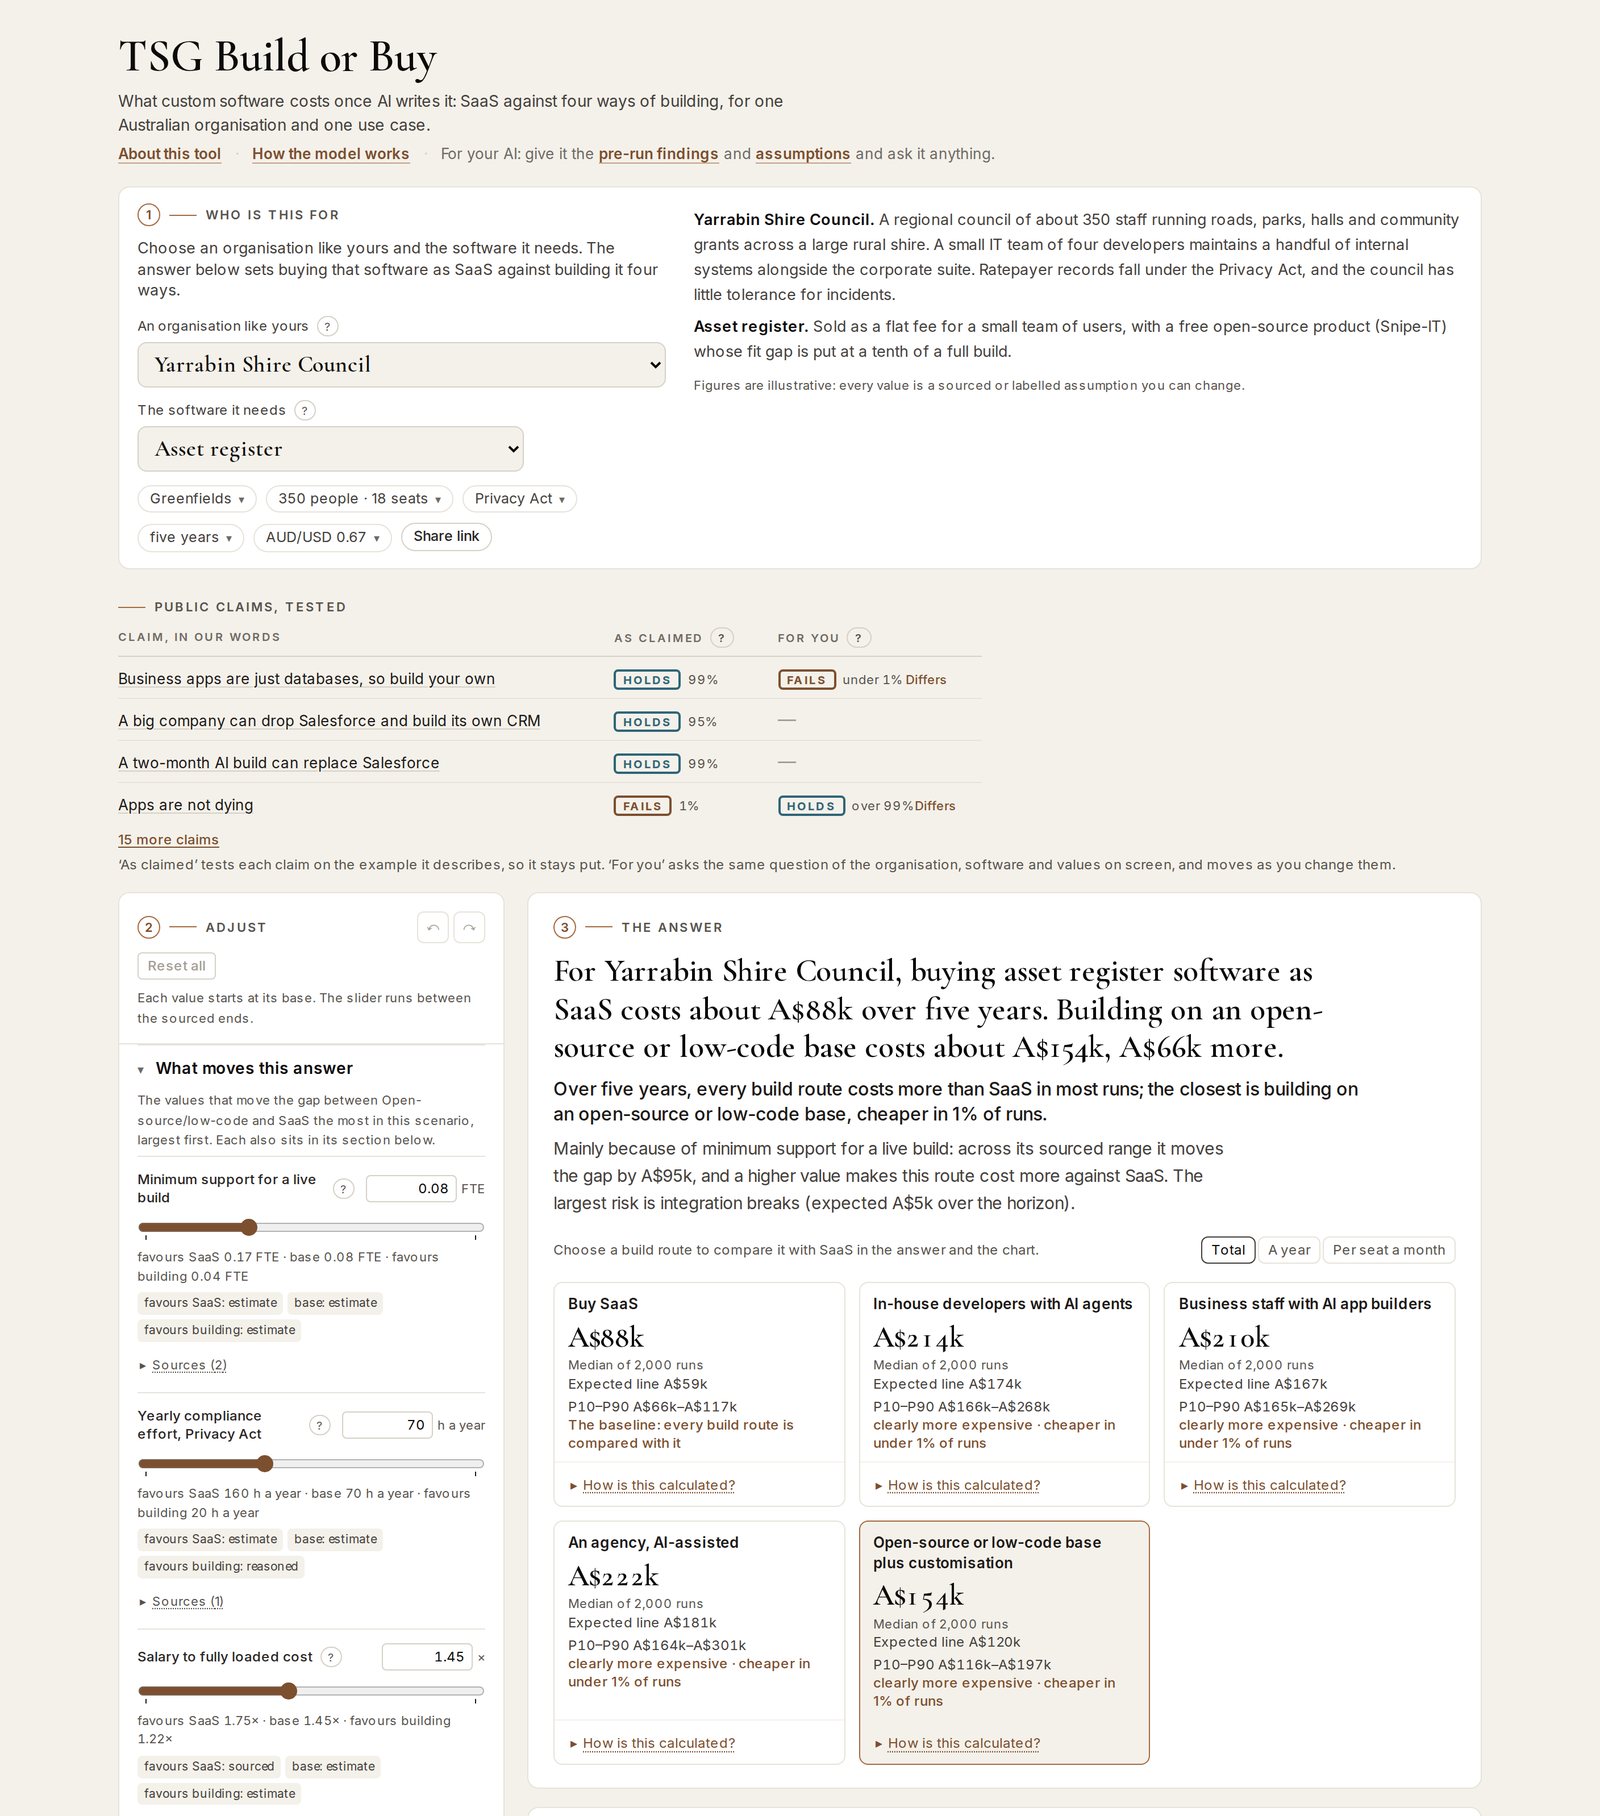
We tried to do this properly, and it was too much for Excel. A spreadsheet holds one number per cell, when every input here is really a range, a risk or an argument, so its bold five-year total is one possible future presented as the future. Here is what the model ended up having to hold.
- Many organisations, many workloads, five routes. Ten made-up Australian organisations, from a 25-person startup to a 3,000-person health network, each with common software they typically need. Buying SaaS is compared against four ways of building: in-house developers with AI coding agents, business staff with AI app builders, an agency, and customising an open-source or low-code base, each costed month by month.
- Risks as events, not fudge factors. The key maintainer leaves. A security incident hits. An integration breaks. The vendor exits, or shocks you at renewal. Each is a probability and a cost, and in any given run it either happens or it doesn't.
- 2,000 runs per scenario. Each run draws every input from its range and replays the risks, so the answer is not "building saves A$200k" but "building costs less than SaaS in 76% of runs".
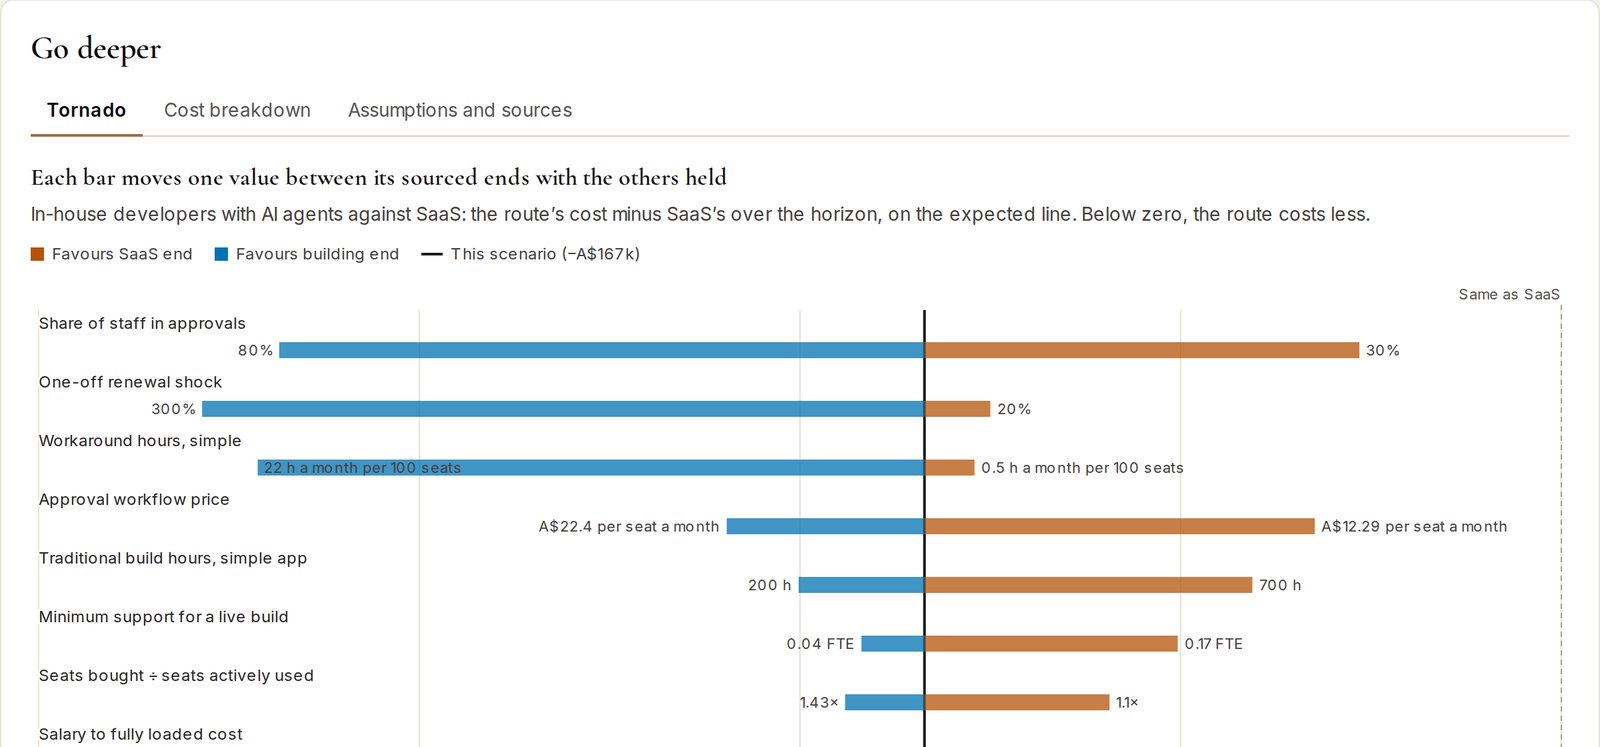
- What moves the answer. Every input is swung across its sourced range and the scenario re-run, so you can see which assumptions carry the result and which you can stop arguing about.
- Public claims, tested. Nineteen claims from both camps, from Satya Nadella and Marc Benioff to Klarna and the NCSC, are as cost questions. The ten the model can answer are run on an organisation the size each claim implies, and again on yours.
- Every figure shows its working. Open any number and the calculation is there, taken from the engine's own trace, so the working shown can't disagree with the figure on screen.
Nineteen claims, in our words
Each claim is restated as a question the model can run, for example: does CRM software built in-house cost less than SaaS, for a made-up 500-person organisation, over five years? The restatements are ours, not the speakers' words, and each is dated and linked to where it was reported.
Speakers with a commercial interest in the answer, such as Microsoft, Salesforce, Nvidia, Atlassian, Palantir and Retool, are labelled as vendor claims. Nine of the nineteen are about things the model takes as inputs, like whether seat counts will fall, and the tool says so rather than testing them.
The claims and their results →To be fair to Excel gurus, a determined analyst with a Monte Carlo add-in and a lot of VBA could build something like it. But nobody else could check it, and checkability was the whole point. A model of a polarised question is only useful if someone from the other camp can open it, find the assumption they disagree with, and change it.
Rules to Keep Ourselves Honest
Given our interest in the answer, we set a few rules before we looked at any results.
- A vendor's claim is never the default. Figures from companies selling AI tools, and from companies selling SaaS, are in the model and clearly labelled. But the starting values always come from independent evidence, not from someone with something to sell.
- Staff time is never free. When staff build or fix their own app, or spend time working around software that doesn't fit, that time is costed at what they are paid. Leave either out and the answer is rigged.
- Each side's blind spots are priced in. Builders tend to forget maintenance, security incidents and the person who built it leaving. SaaS fans tend to forget price rises, seats nobody uses and how hard it is to leave, so both lists are counted.
- It can come out either way. Every input has a low and a high value backed by evidence, and for every answer the tool gives, we check that moving some of those inputs within their ranges can flip it. If it couldn't, the tool would be selling a conclusion rather than testing one.
What the Numbers Say
We ran the model in advance across ten Australian organisations, from a 25-person startup to a 3,000-person health network, each with the software it would plausibly need. That gave 50 scenarios, every input at its base, starting from no system at all, over five years. Here is how some common narratives fared.
Illustrative, not empirical
Yarrabin Shire Council, Coralstone Mutual Bank, Harlow Pennick Lawyers and the rest do not exist. Each is a set of assumptions about headcount, developers, regulation and appetite for risk, given a name so the scenario is easier to think about.
The results below hold for those assumptions only. They are not a claim about what any real council or bank would save, and every value can be changed to match your own organisation.
"SaaS is dead, just build it"
Across the 50 scenarios, the best build route was clearly cheaper than SaaS in 20, leaned cheaper in 3, was too close to call in 5, leaned more expensive in 9 and was clearly more expensive in 13. Certainly sobering reading for the SaaS side, but not SaaSpocalyptic.
Hover over or tap a square to see its scenario. Within each colour, larger organisations come first.
- 20building clearly cheaper
- 3leans cheaper
- 5too close to call
- 9leans more expensive
- 13building clearly more expensive
The pattern underneath is more interesting than the totals: size.
- Under 100 staff (three organisations): building came out cheaper in none of their 13 use cases.
- 150 to 400 staff (four organisations): cheaper in 10 of 21, roughly a coin toss.
- 900 staff or more (three organisations): cheaper in 13 of 16.
Where building came out cheaper, by organisation
Hover over or tap a square to see its scenario.
The reason is unglamorous. SaaS is priced per seat and a build mostly isn't, so the bigger the headcount, the more seats a build stops paying for. A 60-person charity paying A$69k over five years for a forms tool has nothing worth escaping: the cheapest way of building its own costs nearly three times that.
"Business staff will vibe-code their own apps"
For business staff building their own apps with AI app builders, the numbers were thin:
- Leading route in only 4 of the 50 scenarios.
- Cheaper than SaaS in only 8 of the 24 scenarios where it was offered.
- Not offered at all for complex or regulated software, which, for what it's worth, is the UK National point too.
- Easy-to-copy SaaS will be replaced by AI-built apps: we tried it on about the easiest SaaS to copy, a forms and surveys tool for a 200-person organisation. Business staff building their own came out cheaper in only 5% of runs.
- that teams are replacing SaaS with custom builds: building the same forms tool on a low-code base came out cheaper in only 18% of runs.
Retool's build versus buy report
Retool's February 2026 survey reported that 35% of teams had replaced at least one SaaS tool with a custom build, and 78% expected to build more in 2026.
Retool sells an internal-tool builder, and the sample was 817 of its own customers and builders, so the tool labels this a vendor claim.
Retool newsroom, 17 February 2026 →The NCSC on vibe coding
In March 2026 Dave Chismon, the NCSC's CTO for Architecture, wrote that he does not expect organisations to "suddenly vibe code a replacement for their customer relationship management tool".
He also wrote that "the cost/effort curve for 'bespoke enough' software is shifting", and that some of the risks in vibe-coded software are "likely far outside most organisations' risk tolerances".
NCSC blog, 24 March 2026 →Once their time is costed honestly, building and keeping an app alive is not free just because nobody sends an invoice. Cheap SaaS is cheap, and hard to beat.
Hover over or tap a square to see its scenario.
"Maintenance will eat you alive"
Now for the other camp. You will often hear that of the cost of software is maintenance. The range is real, but it seems to anchor to estimates published , mostly about the IT departments of large organisations in the mainframe era.
What newer surveys measure
Sonar surveyed nearly 300 developers in 2019 and found code maintenance took about 30% of their week. A second Sonar survey that year put it at 22% for software developers.
Chainguard's 2026 report, from 1,200 responses collected in August 2025, found engineers spend only around 16% of their week writing code and building new features, and 79% called code maintenance a major drain on their time.
Both sell tools for keeping code healthy and secure, and both measure share of working time, which is not the same thing as share of a system's lifetime cost.
Sonar, 14 March 2019 → Chainguard, 2026 →Who says 60 to 90%
One recent example: in August 2026 Yevgeniy Brikman, author of Hello, Startup, wrote that a vibe-coded replacement "may still turn out to be more expensive than using a paid SaaS product", citing the figure that "60-90% of the costs of software is in maintenance".
It is a fair warning, and a widely repeated number. The chart below is about where that number comes from.
ybrikman.com, 1 August 2026 →The estimates behind the range
Jussi Koskinen of the University of Eastern Finland compiled the estimates most often quoted. They run from 60 to 70% of IT operating budgets at one end to over 90% of total software cost at the other, and no two measure quite the same thing. The chart below sets them side by side.
Koskinen, Software Maintenance Costs, 2015 →There is a second catch. Most of what those estimates call maintenance is not fixing things. About is enhancement: adapting and improving software that people want to keep using. A SaaS subscription pays for that too. It just arrives on the vendor's priorities and timetable.
Maintenance is mostly enhancement
The same compilation cites studies from 1983 to 2000 that put about 75% of maintenance cost into enhancements: adapting software to new needs and improving it, rather than fixing faults.
Koskinen, Software Maintenance Costs, 2015 →Where "60 to 90%" comes from
have mostly asked a different question, how much of a developer's week goes on maintenance, so they can neither confirm that range nor replace it. The model instead assumes 15% of the original build effort goes on maintenance every year, because that is the software firms quote. Separate to this, our tool models upgrades, fixing integrations that break, a minimum level of support, and the risk that the person who looks after it leaves.
That matters: in 9 of the 50 scenarios, the developer time kept on after go-live or the minimum level of support was the biggest factor in the answer. But upkeep doesn't decide things on its own. Even with all of it counted, a 200-person organisation building its own timesheet system in-house came out cheaper than SaaS in 75% of runs.
15 to 20% a year
A US custom-software firm calls "roughly 15–20% of the original development cost" a year a long-standing industry rule of thumb, and two Australian agencies quote the same range. All three sell software development, so read them with that in mind.
The model takes the low end, 15%, because it prices dependency upgrades and integration fixes separately. Together they come to about a fifth of the build effort a year for a typical app, back inside the quoted range.
CodeStringers → Cipher Projects → Hatchet →"It all comes down to how good AI is at coding"
This is the one we find most telling. Almost the entire public debate is about AI coding productivity: is it 20% faster, twice as fast, ten times? The evidence is all over the place. The best independent found developers merging about 1.7 times as many pull requests after adopting coding agents, while controlled trial found gains of 4 to 20%, and the vendors' range far above both.
Carnegie Mellon and Stanford, 2026
He, Agarwal, Denisov-Blanch and colleagues followed 802 developers at one mid-sized company that adopted Claude Code under a mandate, across nearly 200,000 pull requests.
Merged pull requests per developer rose about 1.7 times. Review load per reviewer doubled and total cycle time rose about 22%, so the gain is real but not free. The model's starting value for AI-assisted new code is built on this study.
arXiv, 2 July 2026 →METR
METR is a non-profit research group that sells no coding tools. Its randomised trial of experienced open-source developers found small speedups, which its May 2026 report summarised as "small (~4–20%)" benefits.
METR itself calls this a likely lower bound: 30 to 50% of the developers held back tasks they would not do without AI, so the people who gain most were the least likely to be measured.
METR Frontier Risk Report, 19 May 2026 →The vendors' own figures
Anthropic reported that its typical engineer merged eight times as much code a day in 2026 as in 2024, and called that "almost certainly an overstatement of the true productivity gain".
Figures like this are in the model, labelled as vendor claims, and are never allowed to set a starting value.
Anthropic, When AI builds itself →Yet across all 50 scenarios, AI coding productivity was never the input that moved the answer most. What did were far more boring questions.
What moved the answer most, across 50 scenarios
Those are organisational questions, not AI ones, and you can answer most of them this week without waiting for the next benchmark. The tool shows the same pattern for any single scenario. Here it is for a regional council weighing a document approval workflow:
"It's SaaS or build from scratch"
The debate is framed as a binary, whereas the true reality is more nuanced. In 34 of the 50 scenarios the leading build route was customising an open-source or low-code base, which barely features in the argument at all. Somebody else has already built most of it and you own what you add. An open-source base is often free, but low-code platforms usually charge per seat too, and the model counts that licence wherever there is one.
Which build route came out best, across 50 scenarios
And our own side
In fairness, the model is friendly to some of the claims we would like to be true. Restated for a made-up 500-person organisation, the claim that an AI-assisted build can held in 99% of runs, and Marc Benioff's "" held in 1%. But that is one hypothetical organisation with a lot of CRM seats, and seats are what decide it. For the 60-person charity, the best way of building a CRM was cheaper in only 27% of runs.
Curative and Salesforce
In July 2026 Curative's CEO Fred Turner was reported to have cancelled a Salesforce CRM contract worth about US$600,000 a year after building a replacement with AI-assisted coding in about two months. He also called maintenance one of the hardest parts.
The tool restates this as: does CRM software built in-house cost less than SaaS, for a made-up 500-person organisation, over five years?
Startup Fortune, 22 July 2026 →Marc Benioff, August 2026
Presenting Salesforce's results in August 2026, its CEO said "Apps are not dying. In fact, they are growing", and that AI models depend on CRM rather than replacing it.
Salesforce sells CRM, so the tool labels this a vendor claim. It restates it as: does SaaS cost no more than CRM built in-house, for a made-up 500-person organisation, over five years?
CX Today, 27 August 2026 →It also has something to say about us at TSG Technology. On cost alone, a small organisation with a handful of developers and a CRM to replace comes out too close to call. Ours replaced more than a CRM, including projects, timesheets and OKRs, but even when the tool counts those, the cost case doesn't change much.
That is uncomfortable for a company that built its own and wrote about it. We think it's right, though. We started this business out of testing whether it would work, which we proved. Having proved it, our reasons for doing it again aren't really about cost: control, and a system that grew into the shape of our business rather than the other way around.
Who It Is For
TSG Build or Buy is for the people who have to make this call for real, usually with a renewal date looming and a vendor on one side and an enthusiastic developer on the other. Pick an organisation like yours and the software it needs, then change anything that doesn't fit. It runs entirely in your browser: no sign-in, no email and nothing sent anywhere.
It won't tell you what to do, and it isn't a forecast. It tells you what follows from the values on screen, which of those values carry the answer, and how far you would have to move them for the answer to flip. If you are firmly in one camp, the most useful thing it can do is show you the assumption your position rests on.
It also publishes its assumptions, sources and pre-run findings in plain files alongside the page, so you can hand the lot to your own AI and ask it to find the holes. Please do.
If you disagree with a number, good. We would much rather argue about an assumption than a conclusion, and on a topic this polarised, assumptions are the only place the argument can actually be settled. Change it, press Share link and send us the scenario: the link opens exactly what you were looking at. Then tell us what we got wrong.
This piece follows We Built a CRM. The Bond Market Will Finish the Job. and Where Should Your Tokens Run From? The figures quoted are the tool's pre-run results for invented organisations at base values, as of October 2026, and will move as the evidence does. TSG Technology builds software for organisations and has a commercial interest in the choice to build.